library(plant)
library(regnans)
library(dplyr)
library(ggplot2)Maximum-fitness community assembly
theory
This page uses the maximum-fitness method to assemble a community in the full plant FF16 model. At each step, regnans finds the mutant trait value with the highest invasion fitness in the light environment created by the current residents. It then adds that mutant, returns the community to demographic equilibrium, and removes any resident strategies that have gone extinct.
The first example allows leaf mass per area (lma) to evolve. The second repeats the workflow for height at maturation (hmat). Only one trait varies in each example; all other FF16 traits retain their default values.
Leaf mass per area (lma)
Assembly
# At each step, introduce the mutant with the highest invasion fitness and
# return the community to demographic equilibrium.
control <- assembler_control(
  list(
    run_type = "to_equilibrium",
    birth_type = "maximum",
    birth_move_tol = 1,
    compute_viable_fitness = FALSE
  )
)

# Start with an empty community using the full plant FF16 model.
community0 <-
  community_start(
    bounds = bounds(lma = c(0.01, 2)),
    fitness_control = list(method = "bayesopt", n_evals = 10, n_init = 5),
    demography_control = demographic_step_control(
      list(equilibrium_solver_name = "equilibrium_iteration", equilibrium_nsteps = 10)),
    model_support = list(
      p = plant_default_assembly_pars(max_patch_lifetime = 30),
      plant_control = plant::control())
  )

obj <- assembler_run(assembler_start(community0, control = control), nsteps = 10)
Analysis
Inspect the trait values and birth rates of the resident strategies that remain after assembly:
obj$community$traits lma
[1,] 0.144124obj$community$birth_rate[1] 0.1465716Next, plot invasion fitness across the allowed lma range. Resident strategies are shown as points. At the end of a successful assembly run, they should lie at fitness peaks near zero, with no positive peak at which another mutant could invade:
community_plot_fitness_landscape(obj$community)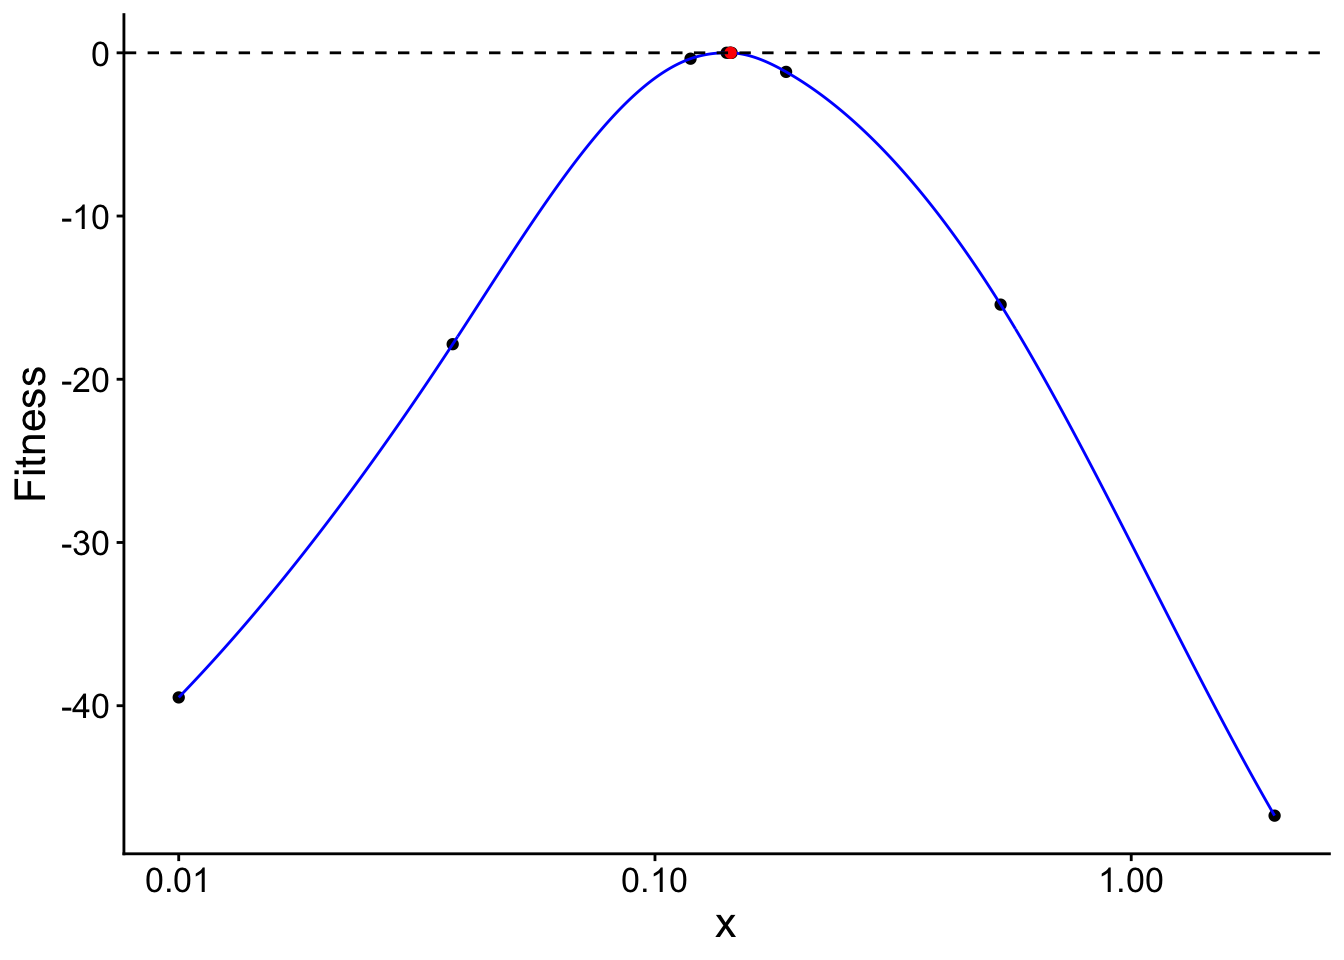
tidy_assembly() returns one row for every strategy at every assembly step. It keeps the traits, birth rates, and fitness landscape for each step in list columns, which is useful for making custom plots of the assembly history:
tidy_assembly(obj)# A tibble: 3 × 6
step strategy_id resident births traits fitness_landscape
<chr> <chr> <lgl> <dbl> <list> <list>
1 2 0.17397370546305 TRUE 0.160 <tibble [1 × 1]> <tibble [10 × 4]>
2 3 0.144123958648406 TRUE 0.147 <tibble [1 × 1]> <tibble [10 × 4]>
3 4 0.144123958648406 TRUE 0.147 <tibble [1 × 1]> <tibble [10 × 4]>Height at maturation (hmat)
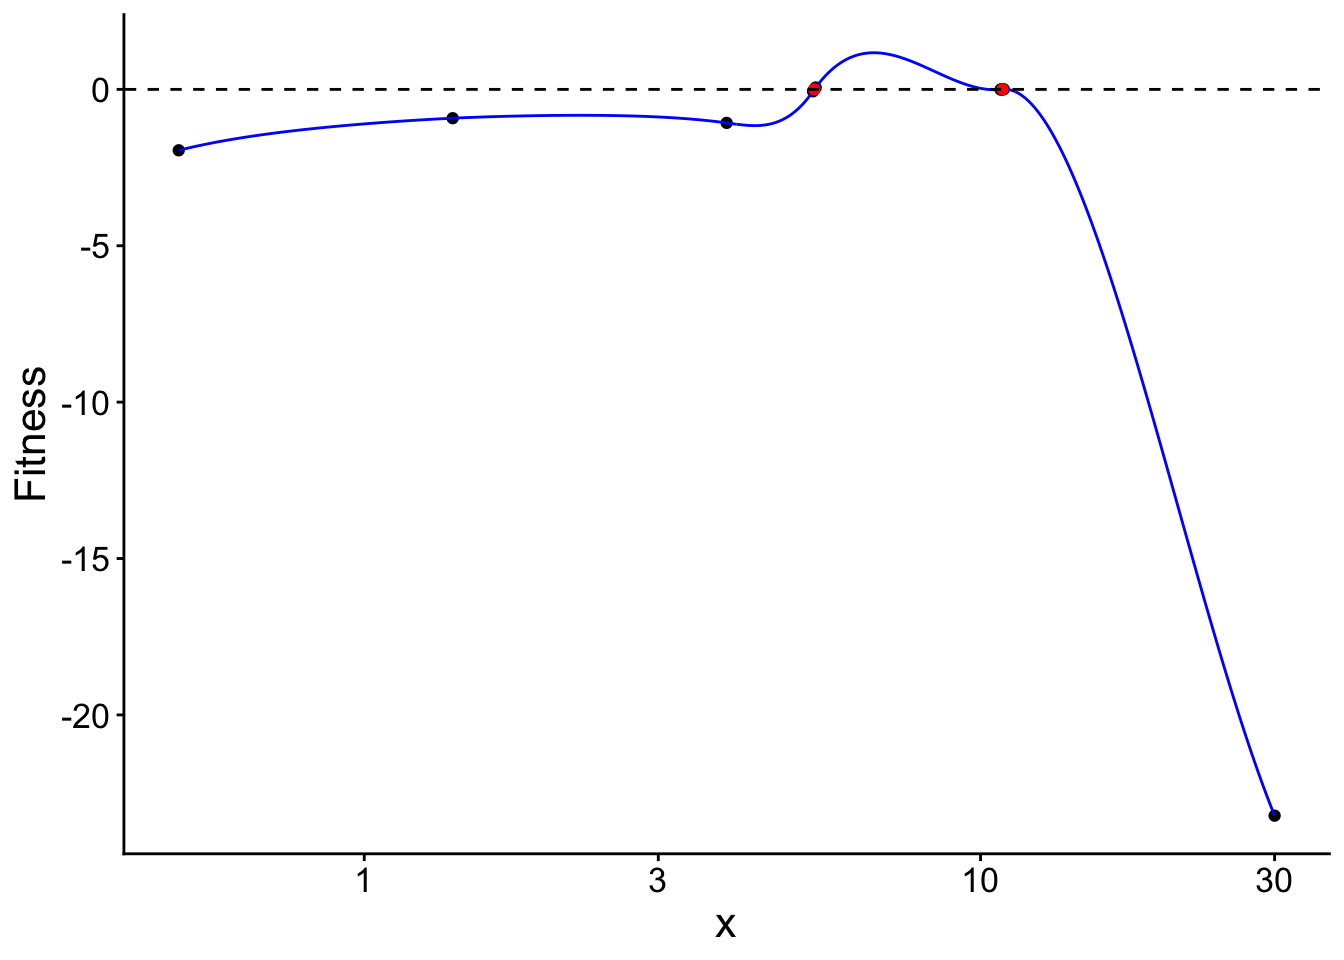
The same method can be applied to height at maturation. Here hmat varies while the other FF16 traits remain fixed at their defaults.
community0 <-
  community_start(
    bounds = bounds(hmat = c(0.5, 30)),
    fitness_control = list(method = "bayesopt", n_evals = 10, n_init = 5),
    demography_control = demographic_step_control(
      list(equilibrium_solver_name = "equilibrium_iteration", equilibrium_nsteps = 10)),
    model_support = list(
      p = plant_default_assembly_pars(max_patch_lifetime = 30),
      plant_control = plant::control())
  )

obj_h <- assembler_run(assembler_start(community0, control = control), nsteps = 10)

obj_h$community$traits
hmat
[1,] 10.855092
[2,] 5.374569obj_h$community$birth_rate[1] 33.70373 167.41592community_plot_fitness_landscape(obj_h$community)