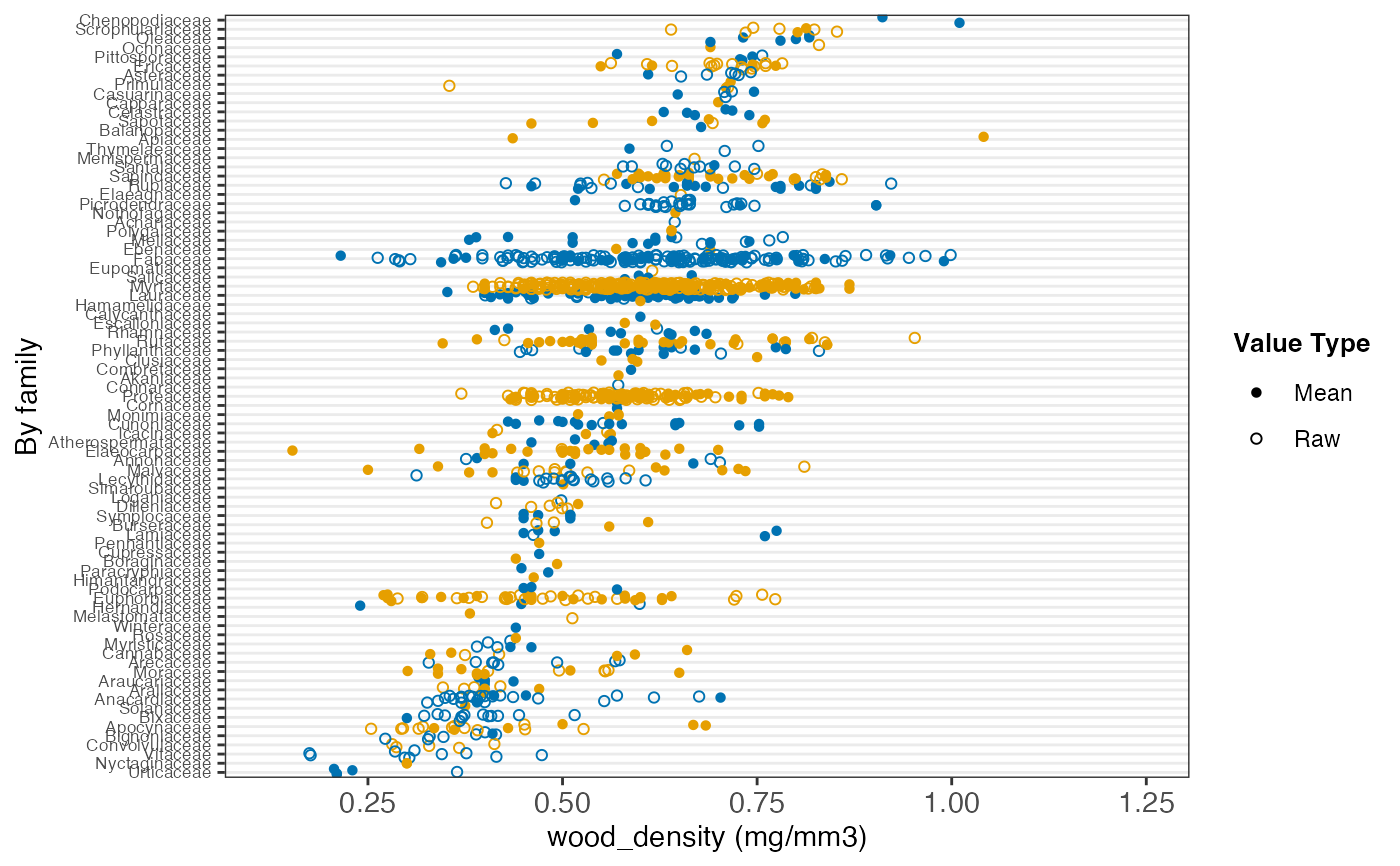
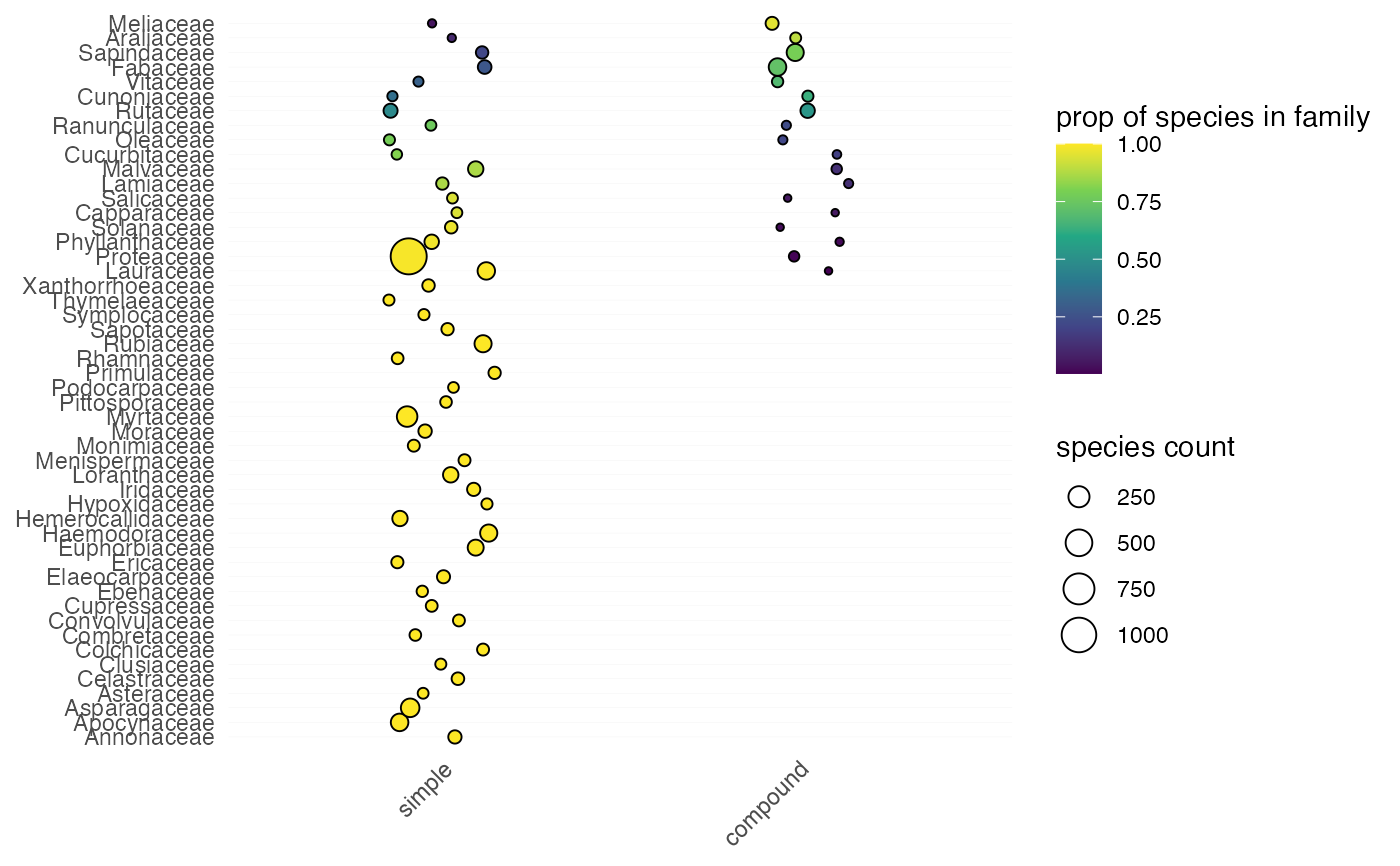
Plots the values of one trait, choosing the plot from the
trait's type: plot_trait_distribution_jitter() by family for a numeric
trait, plot_categorical_trait_distribution() for a categorical one.
Arguments
- database
traits.build database (list object), or its traits table (which must then have a
familycolumn, e.g. fromjoin_taxa())- trait_name
Name of the trait to plot (matched exactly)
- ...
Further named arguments:
y_axis_category(default"family"),highlightandhide_idsfor a numeric trait, passed toplot_trait_distribution_jitter();family_countfor a categorical trait, passed toplot_categorical_trait_distribution(). Arguments the chosen plot does not take are ignored, so one set of arguments can be used for traits of both types.