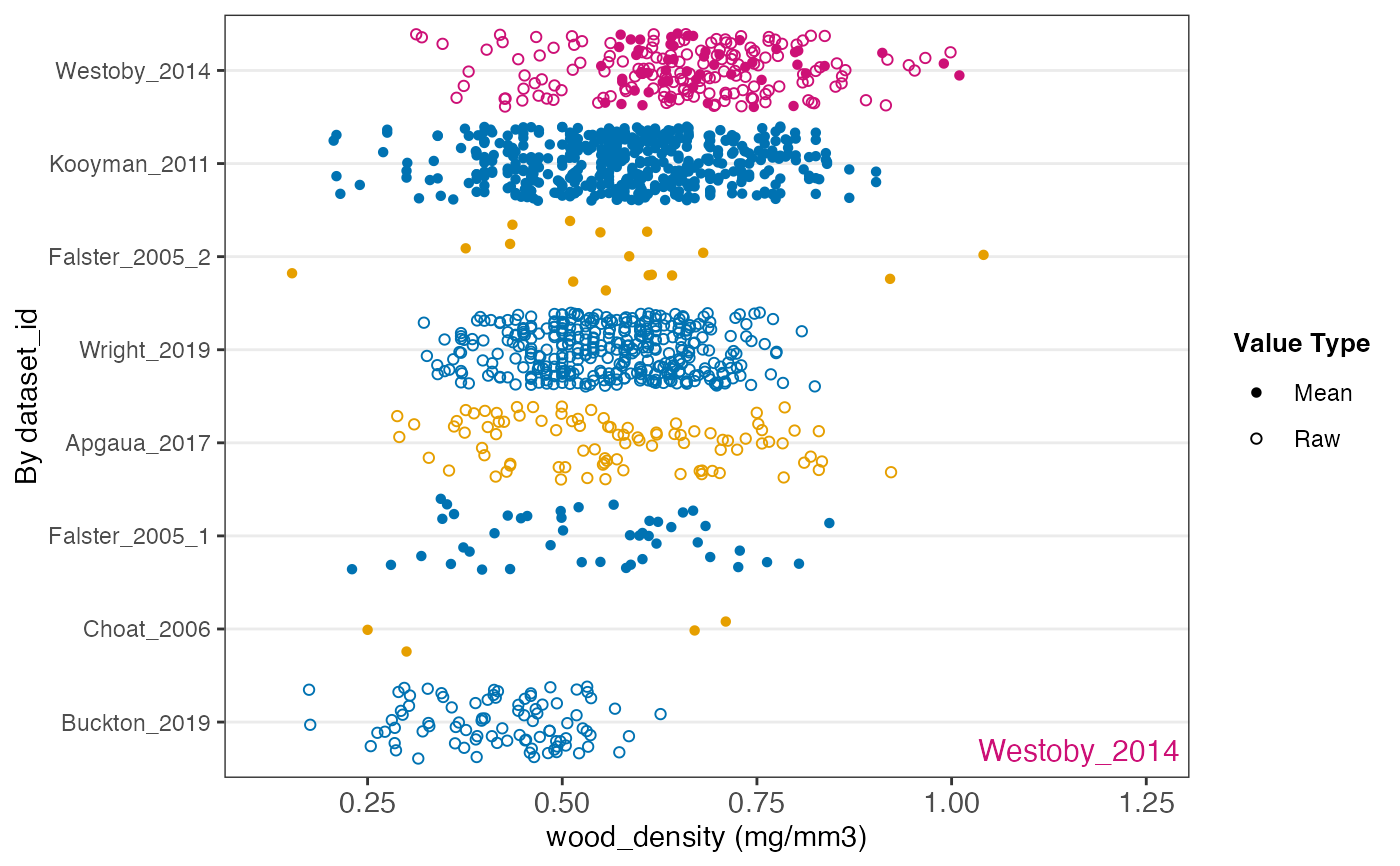
Plot the distribution of a numeric trait by group
Source:R/plot_trait_distribution.R
plot_trait_distribution_jitter.RdPlots the values of a numeric trait as points, one row per
group (e.g. dataset or family), with groups ordered by their mean value.
The shape of each point shows whether it is a minimum, mean, maximum or
raw value. Highlighted groups are drawn in pink and named in the
bottom-right corner, so they can be found with hide_ids = TRUE.
The x-axis is on a log scale when the values are all positive and the
largest is more than about 13 times the smallest (so the axis, padded by
20% each side, spans more than a factor of 20). Values recorded as a bin
or range are left out.
Usage
plot_trait_distribution_jitter(
  database,
  trait_name,
  y_axis_category,
  highlight = NA,
  hide_ids = FALSE
)
Arguments
- database
traits.build database (list object), or its traits table (which must then have a
familycolumn, e.g. fromjoin_taxa())- trait_name
Name of the trait to plot (matched exactly)
- y_axis_category
Column to group values by, e.g.
"dataset_id"or"family".familyandgenusare added from the taxa table whendatabaseis a whole database.- highlight
One or more groups to highlight, e.g. a
dataset_id- hide_ids
Hide the group labels on the y-axis?
Value
A ggplot object, or a blank plot saying there are no numeric values
to plot. Each point also carries a text aesthetic
("dataset_id | taxon_name"), which plotly::ggplotly() shows as a tooltip.
Examples
austraits_lite %>% plot_trait_distribution_jitter("wood_density", "dataset_id", "Westoby_2014")