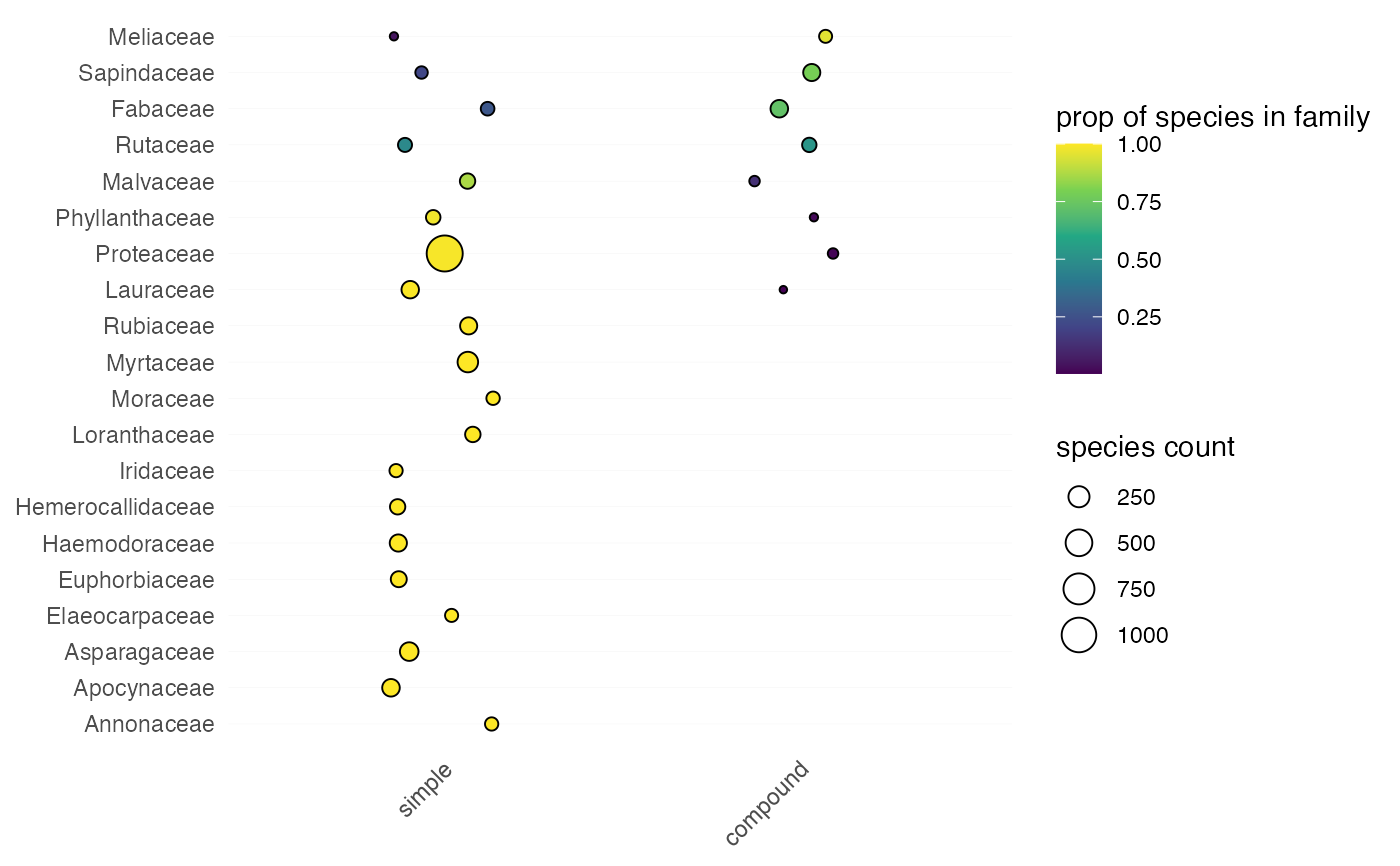
Plot the distribution of a categorical trait by family
Source:R/plot_trait_distribution.R
plot_categorical_trait_distribution.RdFor the families with the most taxa scored for a categorical
trait, plots the proportion of each family's taxa with each value of the
trait. Each taxon counts once: within a dataset, a taxon's distinct values
share its weight equally (a value cell such as "simple compound" counts
as both values), and its datasets are then combined. Point colour shows
that proportion, and point size the number of the family's taxa with any
record of the value. Values are ordered from most to least common in the
families shown. Ties between families at the family_count cut-off are
broken alphabetically.
Arguments
- database
traits.build database (list object), or its traits table (which must then have a
familycolumn, e.g. fromjoin_taxa())- trait_name
Name of the trait to plot (matched exactly)
- family_count
Number of families to show: those with the most taxa scored for the trait
Examples
austraits_lite %>% plot_categorical_trait_distribution("leaf_compoundness", family_count = 20)