Below contains a brief overview on how to get users started with
smatr
More detailed information about the package can be found here: Warton, D. I., Duursma, R. A., Falster, D. S., & Taskinen, S. (2012). smatr 3–an R package for estimation and inference about allometric lines. Methods in Ecology and Evolution, 3(2), 257-259.
First, install smatr`
# Install via CRAN or github
install.packages("smatr")
devtools::install_github("dfalster/smatr3")
then load the library
Note we will illustrate some of the core functions of
smatr using one of the two data sets included in the
package
One sample analyses
Users can fit a single major axis to their data using the
ma(y ~ x) or sma(y ~x) functions for y against
x. The log argument allows quick transformations to one or
both axes before estimation occurs. For example:
# Extract only low-nutrient, low-rainfall data from leaflife dataset:
leaf.low <- subset(leaflife, soilp == 'low' & rain == 'low')

# Fit a single MA for log(leaf longevity) vs log(leaf mass per area):
ma(longev ~ lma, log='xy', data=leaflife)
#> Call: sma(formula = ..1, data = ..3, log = "xy", method = "MA")
#>
#> Fit using Major Axis
#>
#> These variables were log-transformed before fitting: xy
#>
#> Confidence intervals (CI) are at 95%
#>
#> ------------------------------------------------------------
#> Coefficients:
#>             elevation    slope
#> estimate    -3.085214 1.492616
#> lower limit -3.968020 1.146777
#> upper limit -2.202407 2.001084
#>
#> H0 : variables uncorrelated
#> R-squared : 0.4544809
#> P-value : 4.0171e-10
Testing for significance
Users can specify using the argument slope.test in the
ma() or sma() function to test whether the
estimated slope is significantly different from 1. Calling summary to
sma or ma objects will return confidence
intervals for the slope and/or elevation.
# Test if the MA slope is not significantly different from 1 for longevity and leaf mass per area (LMA):
ma_obj <- ma(longev ~ lma, log='xy', slope.test=1, data=leaflife)

summary(ma_obj)
#>       group  n        r2        pval    Slope Slope_lowCI Slope_highCI
#> group   all 67 0.4544809 4.01707e-10 1.492616    1.146777     2.001084
#>             Int Int_lowCI Int_highCI Slope_test Slope_test_p Elev_test
#> group -3.085214  -3.96802  -2.202407          1  0.003539277        NA
#>       Elev_test_p
#> group          NA
plot(ma_obj)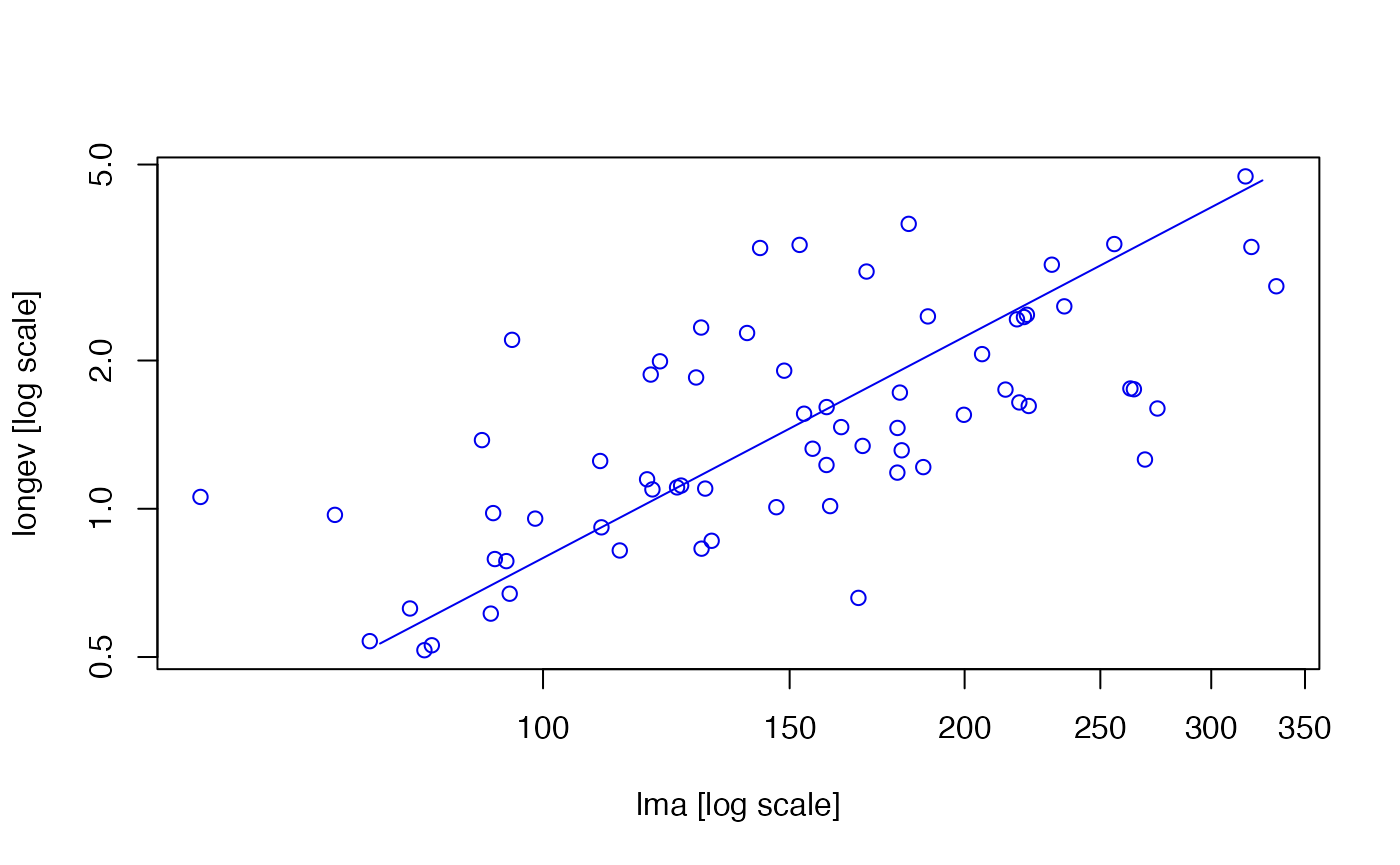
Multiple sample analyses
Often researchers wish to compare between slopes or intercepts of axes between different groups. Lets say we want to compare between high and low rainfall for low nutrient sites ONLY
# First we subset the data that is relevant
leaf.low.soilp <- subset(leaflife, soilp == 'low')

# Then using * we can fit SMAs separately at each of high and low rainfall sites and test for whether sites with different rainfall share a common slope
rain_sma_obj <- sma(longev~lma*rain, log="xy", data=leaf.low.soilp)

# Lets plot longevity vs LMA separately for each group first:
plot(rain_sma_obj)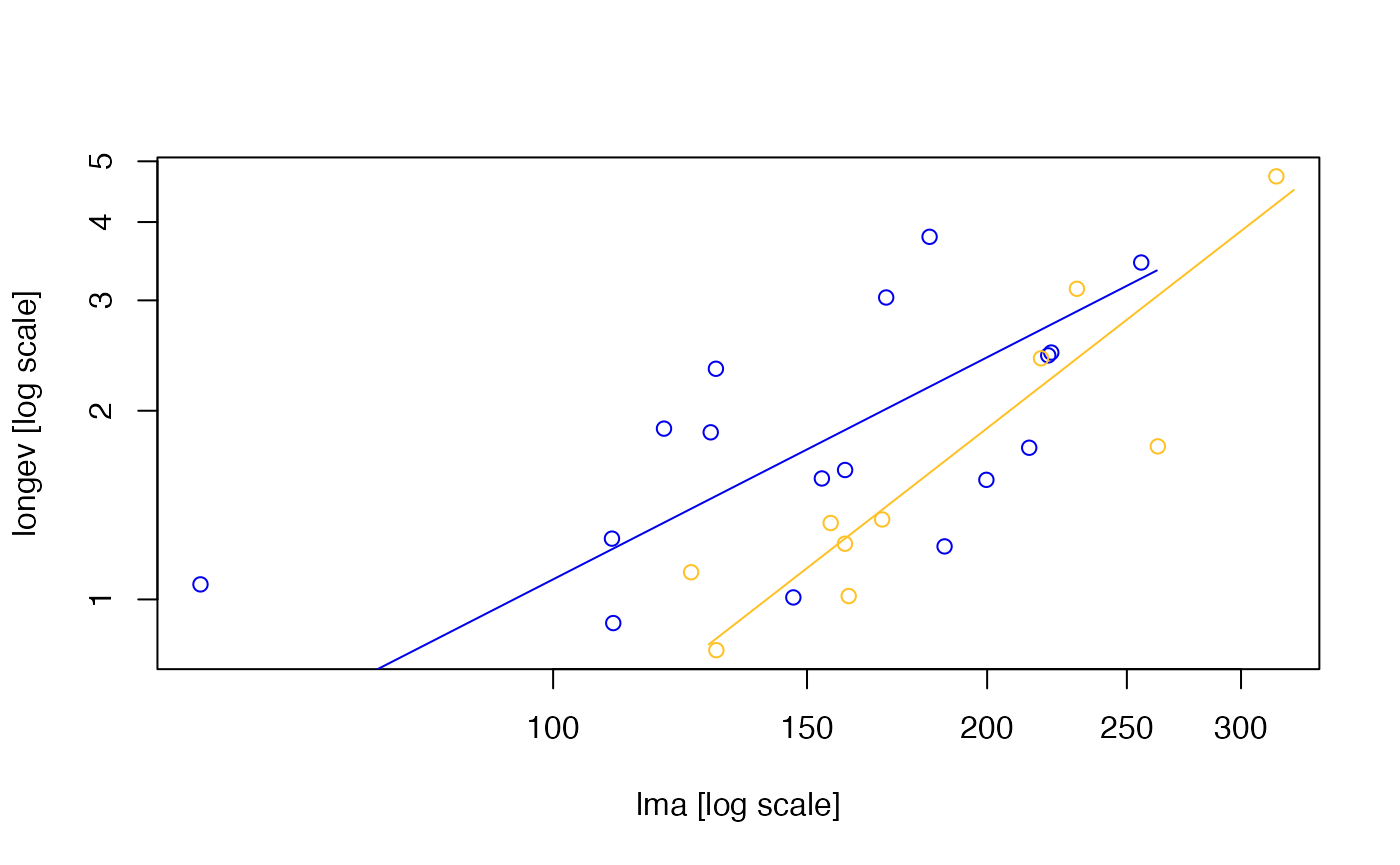
The same fit can be drawn with ggplot2 by calling
ggplot() on the fitted object. This plots the data and
fitted (S)MA line(s), colours by group where present, and log-scales any
axes that were log-transformed in the fit. Because it returns a standard
ggplot object, you can add themes, labels and further
layers as usual:
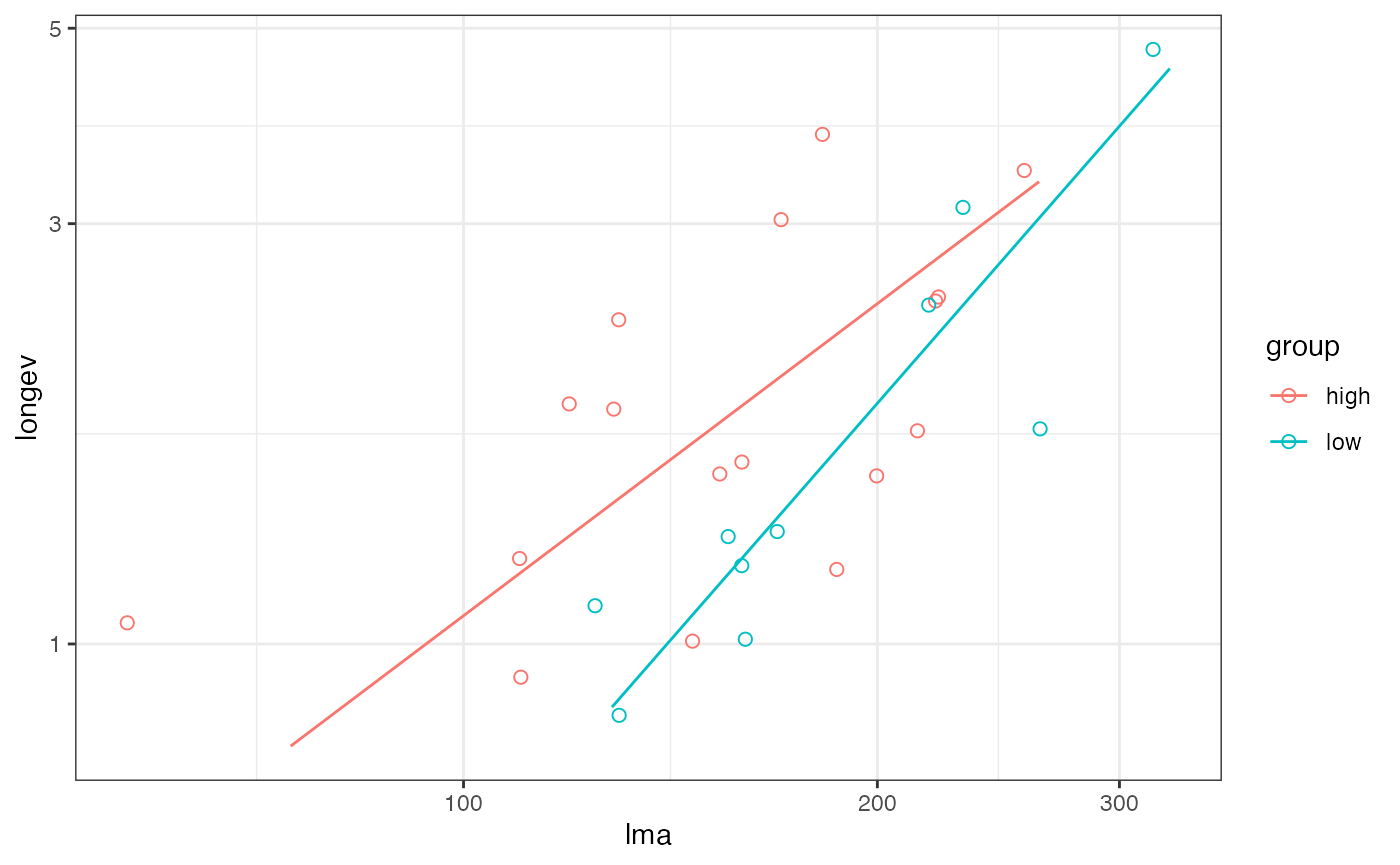
# The result is a normal ggplot object, so extend it however you like:
ggplot(rain_sma_obj) +
  theme_minimal() +
  labs(title = "Leaf longevity vs LMA", colour = "Rainfall")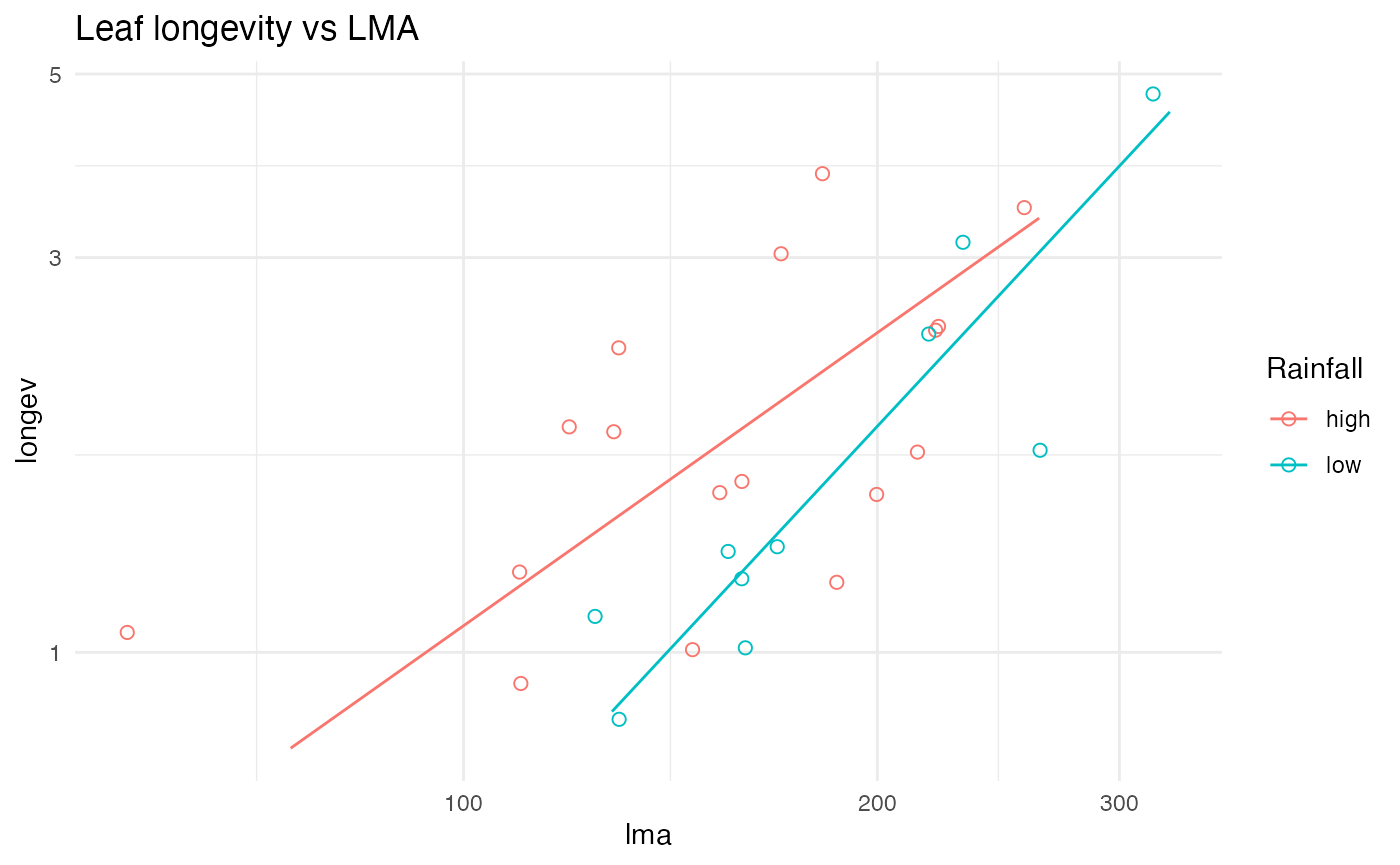
By default, the sma() function will first fit a common
slope for all groups and then test whether there is a difference in
elevation
# Fit SMAs for each group and tests if several SMA lines share a common slope.
rain_sma_obj <- sma(longev~lma*rain, log="xy", data=leaf.low.soilp)

summary(rain_sma_obj)
#>   group  n        r2         pval    Slope Slope_lowCI Slope_highCI       Int
#> 1  high 17 0.3407371 0.0138909094 1.176888   0.7631512     1.814929 -2.321737
#> 2   low 10 0.8065100 0.0004170919 1.786551   1.2572572     2.538672 -3.837710
#>   Int_lowCI Int_highCI Slope_test Slope_test_p Elev_test Elev_test_p
#> 1 -3.475559  -1.167915         NA           NA        NA          NA
#> 2 -5.291926  -2.383495         NA           NA        NA          NA
Again, using the slope.test will test whether the common
slope is significantly different to 1.
# Fit SMAs separately at each of high and low rainfall sites,
# and test if there is a common slope and whether it is equal to 1:
rain_slope_obj <- sma(longev~lma*rain, log="xy", slope.test=1, data=leaf.low.soilp)

summary(rain_slope_obj)
#>   group  n        r2         pval    Slope Slope_lowCI Slope_highCI       Int
#> 1  high 17 0.3407371 0.0138909094 1.176888   0.7631512     1.814929 -2.321737
#> 2   low 10 0.8065100 0.0004170919 1.786551   1.2572572     2.538672 -3.837710
#>   Int_lowCI Int_highCI Slope_test Slope_test_p Elev_test Elev_test_p
#> 1 -3.475559  -1.167915          1   0.44732920        NA          NA
#> 2 -5.291926  -2.383495          1   0.00427036        NA          NA
The type argument allows users to test for a change in
elevation
# Fit SMAs separately at each of high and low rainfall sites, and test whether sites differ in the elevation of their SMA
rain_elev_obj <- sma(longev~lma*rain, log="xy", type = "elevation", data=leaf.low.soilp)

summary(rain_elev_obj)
#>   group  n        r2         pval    Slope Slope_lowCI Slope_highCI       Int
#> 1  high 17 0.3407371 0.0138909094 1.176888   0.7631512     1.814929 -2.321737
#> 2   low 10 0.8065100 0.0004170919 1.786551   1.2572572     2.538672 -3.837710
#>   Int_lowCI Int_highCI Slope_test Slope_test_p Elev_test Elev_test_p
#> 1 -3.475559  -1.167915         NA           NA        NA          NA
#> 2 -5.291926  -2.383495         NA           NA        NA          NA
The type argument allows users to also test for shifts
along a common axis
# Fit SMAs with common slope across each of high and low rainfall sites, and test for no shift along common SMA:
rain_shift_obj <- sma(longev~lma+rain, log="xy", type="shift", data=leaf.low.soilp)
summary(rain_shift_obj)
#>   group  n        r2         pval  Slope Slope_lowCI Slope_highCI       Int
#> 1  high 17 0.3407371 0.0138909094 1.5514    1.109374     2.011726 -3.140896
#> 2   low 10 0.8065100 0.0004170919 1.5514    1.109374     2.011726 -3.304865
#>   Int_lowCI Int_highCI Slope_test Slope_test_p Elev_test Elev_test_p
#> 1 -3.475559  -1.167915         NA           NA        NA          NA
#> 2 -5.291926  -2.383495         NA           NA        NA          NA