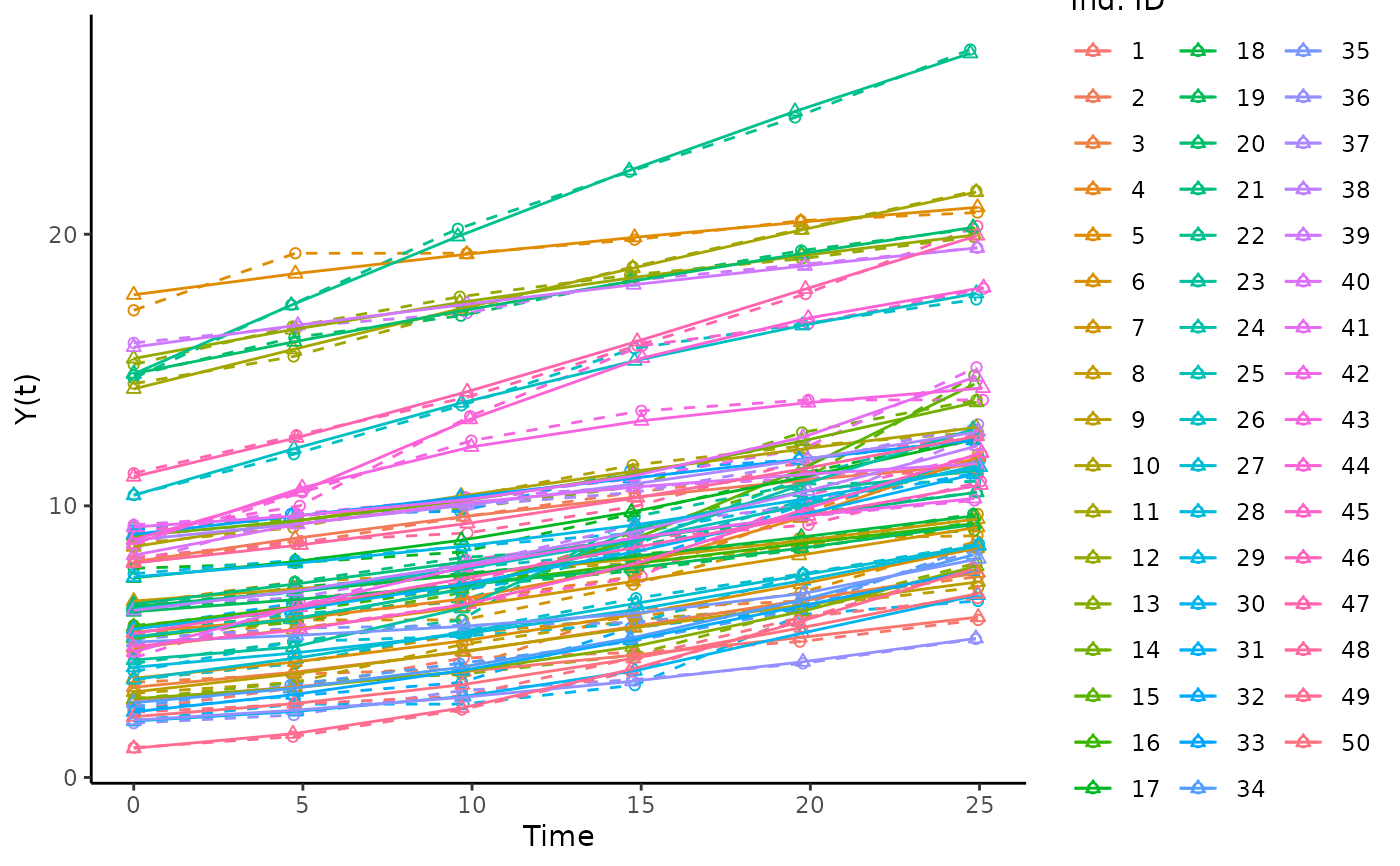
Plot estimated and observed values over time for a chosen number of individuals based on posterior estimates. Structured to take in the measurement_data tibble constructed by the hmde_extract_estimates function.
Source:R/hmde_plot_obs_est_inds.R
hmde_plot_obs_est_inds.RdPlot estimated and observed values over time for a chosen number of individuals based on posterior estimates. Structured to take in the measurement_data tibble constructed by the hmde_extract_estimates function.
Usage
hmde_plot_obs_est_inds(
  estimates = NULL,
  ind_id_vec = NULL,
  n_ind_to_plot = NULL,
  xlab = "Time",
  ylab = "Y(t)",
  title = NULL
)
Arguments
- estimates
hmde_estimates class object
- ind_id_vec
vector with list of ind_id values
- n_ind_to_plot
integer giving number of individuals to plot if not specified
- xlab
character string for replacement x axis label
- ylab
character string for replacement y axis label
- title
character string for replacement plot title