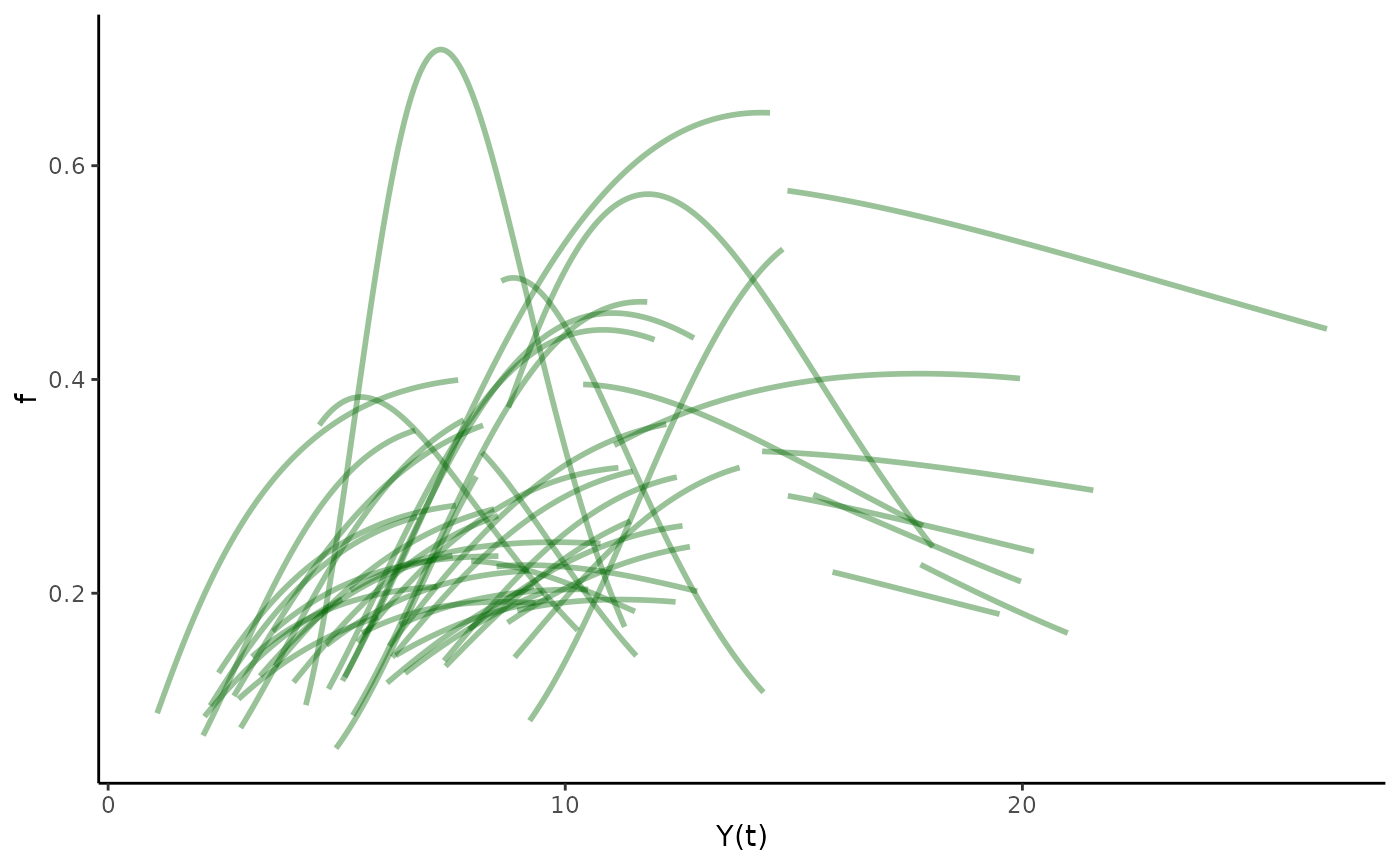
Plot pieces of chosen differential equation model for each individual. Structured to take the individual data tibble that is built by the hmde_estimates function using the ind_par_name_mean estimates. Function piece will go from the first fitted size to the last. Accepted ggplot arguments will change the axis labels, title, line colour, alpha
Source:R/hmde_plot_de_pieces.R
hmde_plot_de_pieces.RdPlot pieces of chosen differential equation model for each individual. Structured to take the individual data tibble that is built by the hmde_estimates function using the ind_par_name_mean estimates. Function piece will go from the first fitted size to the last. Accepted ggplot arguments will change the axis labels, title, line colour, alpha
Usage
hmde_plot_de_pieces(
  estimates = NULL,
  xlab = "Y(t)",
  ylab = "f",
  title = NULL,
  colour = "#006600",
  alpha = 0.4
)